Solution program (Gabe's Julia (Jupyter notebook) version) [hw1_sol.ipynb]
Solution program (Anders' old Fortran90 version) [rwalk.f90]
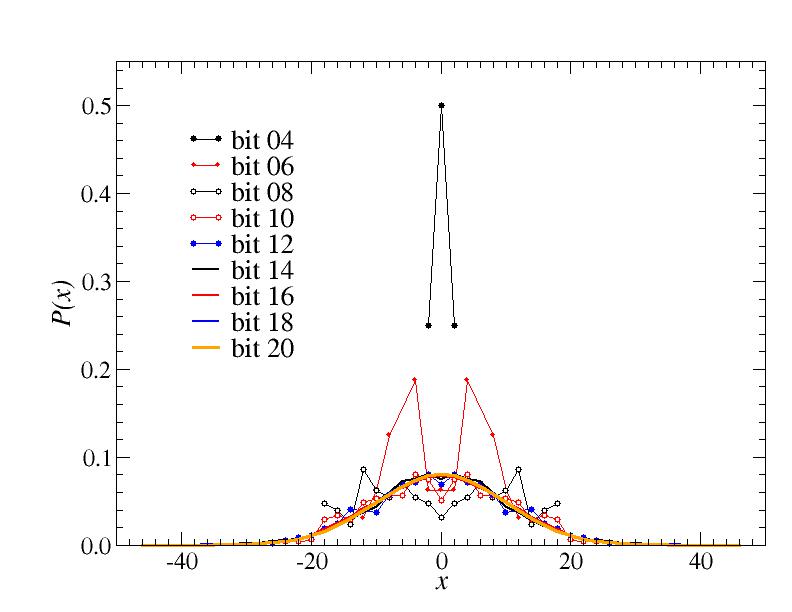
As in the examples for "smaller" random-number generators discussed in class, bit 0 alternates between 0 and 1, while higher bits show an increasingly "random" behavior. Translating this kind of behavior to probability distributions of the random walk, it's clear that the bit-0 walker will not "get anywhere" (x=0 after any even number of steps), while the higher bits develop gradually into distributions approaching that of an unbiased random walk.
Below is a graph showing probability distributions for some of the bits:
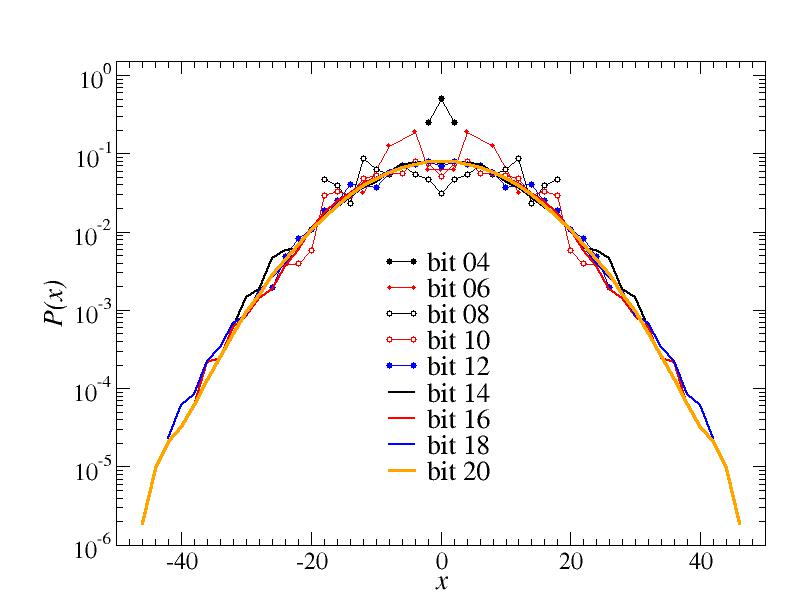
The same data with the probabilities on a log scale:
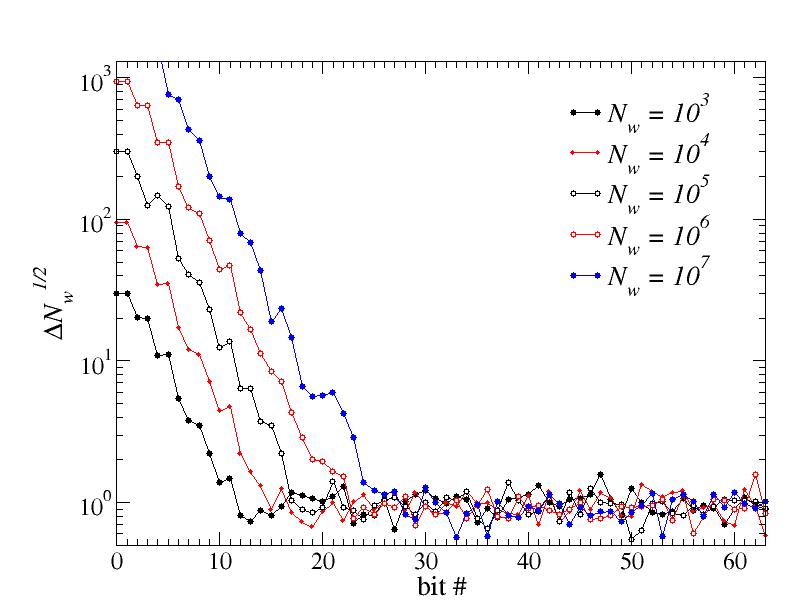
A divergence with the number of walks implies a statistically detectable deviation from the correct distribution, while values around 1 correspond to no detectable deviations (given the number of walks). Note that the oscillations around 1 will not diminish with increasing N_w, because the measure contains a factor sqrt(N_w), which cancels out the 1/sqrt(N_w) behavior of the statistical error of Delta itself.
From these results we can conclude that the low bits are very bad random generators for 0,1 sequences. The behavior improves quickly with increasing bit number, but at some level of precision (here number of walks, in general the length of the sequence of bits) they all show deviations. However, the high bits (upper half or so) should break down only for extremely long sequences. Because of this, floating-point numbers generated based on this random-integer generator are sufficiently good random numbers for most applications.
Note that we have here not addressed the important issue of correlations between the bits, which, if significant, would case bad behaviors for the generated integer. It turns out that this kind of generator do not have any 2-point correlations between the bits (on average). Higher-order correlations may still exist.