2D color intensity plot program
This is a program for creating very simple color intensity plots. The program reads m*n function values from a file (one value per line), and plots these as a 2D matrix with the smallest value represented by black, the largest by white, and intermediate values by a particular color scale.
The Fortran 90 source code is availabe here.
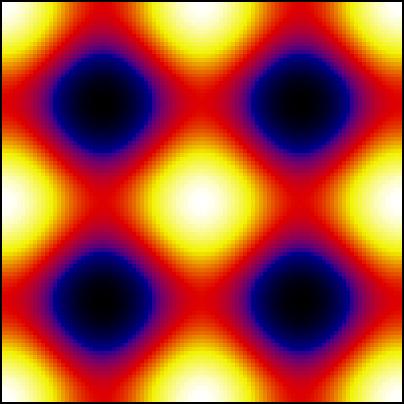
This is an example of a graph produced with this program, showing the function f(x,y)=cos(x)**2+cos(y**2) in the range x,y=[-pi,pi].